TLDR; we suggest that an existing metric, r2ER, should be preferred as an estimator of single neuron representational drift rather than the representational drift index (RDI, Marks and Goard, 2021) because it isn’t clear what intermediate values of RDI mean.
Often, neuroscientists quantify how similar two neural tuning curves are. The correlation coefficient is a common metric of similarity. Yet it has a substantial downward bias proportional to how noisy the neurons are and inversely proportional to the number of repeats collected. This bias with respect to ‘measurement error’, is well known in the statistics literature but largely unaddressed in neuroscience.
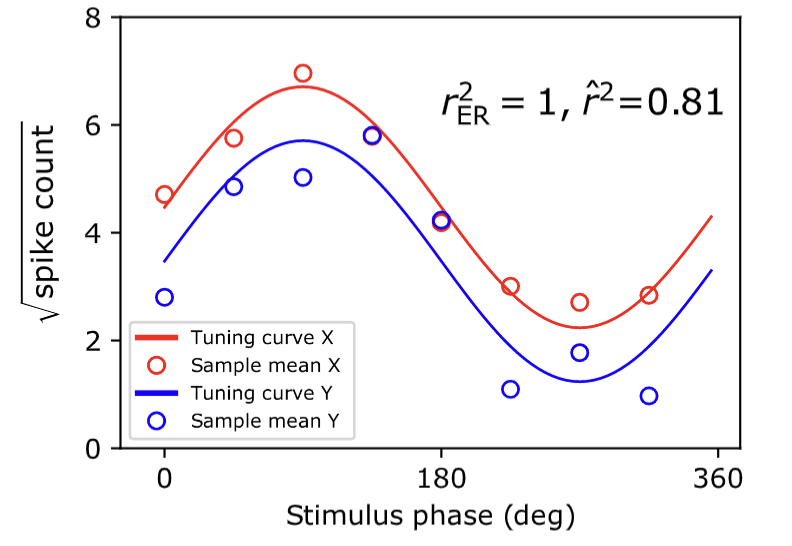
The problem is made clear in the figure below, where two perfectly correlated tuning curves (solid lines, red and blue) appear to be different when noisy trial averages (red and blue circles) are used to estimate their correlation.

Recently we (Pospisil and Bair, 2022) have developed a far more accurate estimator of tuning curve correlation. It even beats out Spearman (1904) whose approach to the problem had been the de facto standard for the past century and change.
We worked on this problem because of the ubiquity of questions pertaining to the similarity of tuning curves across neurons (w.r.t. cortical distance, image transformations, physical space, experimental conditions). Recently, though an exciting and novel area of research has begun around the similarity of tuning curves of neurons across time. It has been found that tuning curves drift and this phenomenon has been termed ‘representational drift’.
Here we suggest that our estimator developed in the context of signal correlation could also serve as a useful metric of single neuron representational drift. Examining the literature we found a few emerging metrics of representational drift but only one among them that attempted to explicitly account for the confound of trial-to-trial variability in estimating tuning curve similarity: the representational drift index (RDI) (Marks and Goard, 2021).
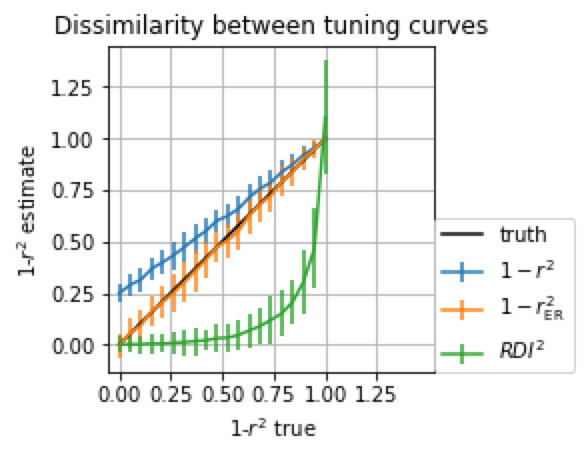
We ran a simple simulation of two neural tuning curves with noisy samples (same as the plot above) and adjusted the fraction of variance explained between them (by adjusting phase) to see how different estimators compared relative to the true r2.
We compared our metric, the naive estimator (used by a variety of authors), and RDI.

We found that in general, the naive estimator tended to estimate two tuning curves were dissimilar when they were identical and both r2ER and RDI accurately determined that they were identical (orange and green overlaid at 1- r2 =0). On the other hand for intermediate degrees of similarity, for example when 1- r2 = 0.9 RDI was only halfway to its maximal value of 1 when only 10% of tuning between the two tuning curves was shared.
But wait a minute! Is this fair to compare RDI on the basis of r2? That is not what it was designed to estimate.
This gets to a deeper statistical question. What is RDI supposed to be an estimator of? While qualitatively the answer seems clear ‘how similar two tuning curves are’, quantitatively it is not clear what parameter of what statistical model the metric is an estimator of. This makes RDI difficult to interpret,
Thus we humbly suggest that r2ER can serve as an accurate interpretable metric of representational dissimilarity.
